TCC’s Chris Clarke explores the different types of challenge that the five pilot councils chosen as part of the government’s Integrated Communities strategy are likely to face.
Images taken from here, here, here, here, and here.
The Housing, Communities and Local Government Department announced its Integrated Communities Green Paper last month. The aim of the strategy is to build on the 2016 Casey Review, so as to create more resilient communities.
The issue of cohesion has, of course, achieved added resonance following the Brexit vote, which appeared to shed light on a growing sense of a lack of cultural cohesion in the UK.
As part of the strategy, the government has picked out five local authorities in which to pilot projects: Blackburn with Darwen, Bradford, Peterborough, Walsall and Waltham Forest. These areas have been ear-marked as examples of places with particular risk of cultural exclusion, and given extra resources to develop integration plans.
They are interesting areas, each with a different sense of identity and set of challenges. We thought we’d put them into context on the basis of historic levels of immigration, recent demographic change, and the characteristics of minority groups living there.
To do this we’ve used Origins, a tool developed by our partners Webber Phillips. It uses name recognition technology to map the pace, level and makeup of ethnocultural shifts right down to unit postcode level. This allows more preventative cohesion policies, so local authorities can direct resources to particular neighbourhoods – predicting service pressures and cultural tensions. Councils can develop strategies which build social capital, and reinforce communities against those with a non-inclusive agenda.
*
To begin with let’s explore, at local authority level, two factors: historic size of the non-white British (WB) community in each area, and more recent rates of change in the non-WB population.
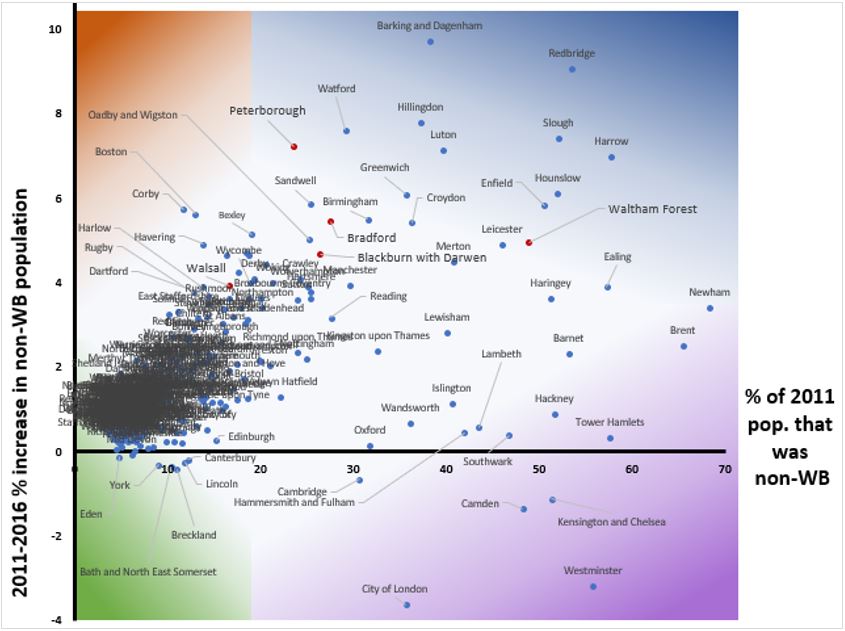
The scatter chart below shows all of Britain’s 372 councils – comparing the level of the non-WB population in 2011 against the increase in the following five years.
Those furthest to the right on the ‘X’ axis, such as Newham and Brent, started out in 2011 with the proportionally largest non-WB populations. Those highest up on the ‘Y’ axis, such as Barking and Dagenham, have had the biggest subsequent increases (in the years up to 2016).
We’ve picked out in red the five councils chosen for the Integrated Communities Strategy.
Bradford and Blackburn seem to have fairly similar cohesion stories to each other. Non-WB groups accounted for just under 30% in 2011 in both – with increases of about 5% since. Peterborough has lower initial levels but higher recent change. Walsall has lower levels and lower change. And Waltham Forest has a much bigger non-WB population than any of the other councils, but a rate of change similar to that of Bradford and Blackburn.
However, all five are comparatively extreme in ethnocultural terms – at least compared to the large cluster of overlapping authorities (towards the bottom left of the chart), who have small non-WB populations and low recent change. This latter grouping makes up a good three fifths of British councils (although many are district councils, with smaller populations).

What does this actually mean for the challenges and threats each of the five pilot councils face?
The academic Eric Kaufman’s analysis of the 2008 BNP vote in the GLA elections emphasises the “distinction between levels and changes in diversity at the local level” (my italics). Kaufman writes that “The former dampens anti-immigration feeling while the latter elevates it.” In other words, places with larger non-WB minorities tend to end up with more liberal attitudes to newcomers – but the initial change creates greater tensions and hostilities. This explains why places with lower non-WB populations are often more hostile to immigration. It’s the prospect not the reality that generally creates unease.

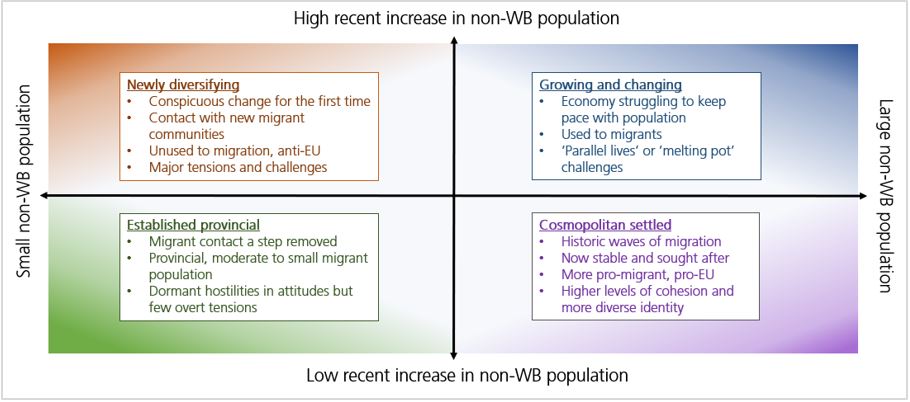
The spectrum above visualises this. The colours correspond to those on the scatter chart (they’re faded to be darker in the places where the characteristics are more acute).
It splits the country into four basic types of area: ‘Established Provincial’ (low historic level, low recent change); ‘Newly Diversifying’ (low historic level, high recent change); ‘Growing and Changing’ (high historic level, high recent change); and ‘Cosmopolitan Settled’ (high historic level, low recent change). At a very ‘macro’ level (e.g. over the course of three or four decades), transitions through these four stages often happen sequentially – although in truth it is rarely this straightforward. But there’s a theory of change of sorts buried within the model.
Each of these types of place requires a different sort of cohesion approach.
‘Cosmopolitan Settled’ areas often have high integration between ethnocultural groups – with historic waves of migration having now stabilised. A lot of these are inner London boroughs, which experienced tensions when they were ‘Newly Diversifying’ in the 1960s and 1970s. (The National Front frequently did well in places like Hackney and Lambeth, for example). Many then became ‘Growing and Changing’ and have now plateaued – or even become more WB, as a result of gentrification.
Conversely, ‘Newly Diversifying’ areas – which are effectively the opposite of ‘Cosmopolitan Settled’ ones – are at the start of a new relationship with migration, and often face the biggest threats to cohesion. Rapid ethnocultural change is new in these places, and communities and councils have little experience of addressing it. East of England towns with new waves of Eastern European migration are examples here.
Of our five authorities Walsall and Peterborough are the closes, to this corner of the graph. They’ll need to work hard to manage and understand the new communities and think through the transition at play.
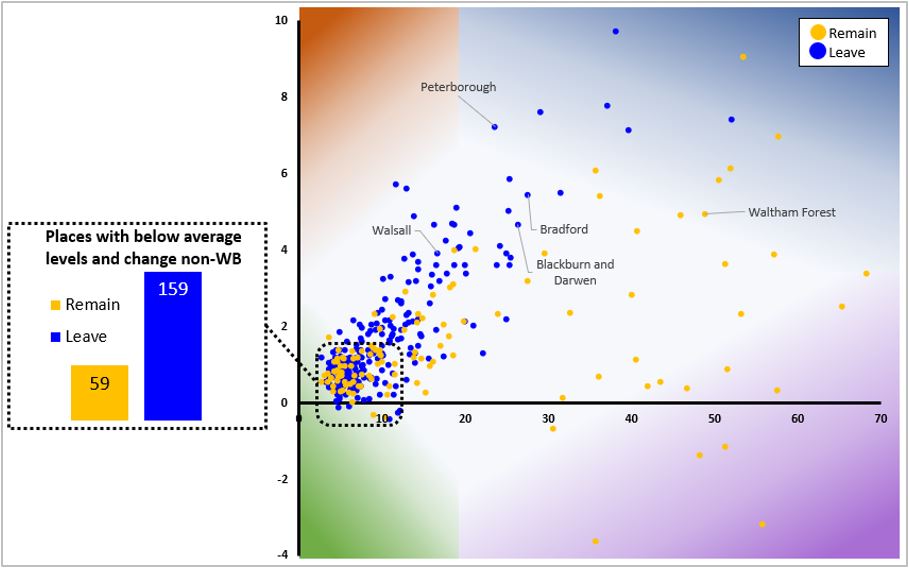
The EU referendum outcomes are a useful way of understanding this, and can be seen as a rough proxy for migration sentiment. The scatter diagram below replicates the above chart, but with the place labels removed and the Brexit results coloured in.

There are clearly explanations beyond migration for why different places voted as they did in June 2016. But by looking at the chart we can see a clear correlation between an area’s historic and recent experience of ethnocultural change, and its referendum vote. Waltham Forest is the only Remain-voting authority among the five government pilots – and it’s no surprise when you look at where it stands on the spectrum.
In particular, it’s notable that the places most obviously exhibiting ‘Newly Diversifying’ characteristics almost all voted very heavily to Leave the EU. Corby, Boston, Havering, Thurrock, Walsall, Harlow, Rugby, Dartford, Bolton and Rushmoor are the most extreme ‘Newly Diversifying’ areas. They had an average Leave vote of 66%.
By contrast, the outcomes were overwhelmingly in favour of the EU among their ‘Cosmopolitan Settled’ equivalents. Across the most extreme ‘Cosmopolitan Settled’ councils – Islington, Hackney, Wandsworth, Lambeth, Hammersmith & Fulham, Southwark, Tower Hamlets, Oxford, Cambridge, Kensington & Chelsea, Camden, Westminster and the City of London – the average Remain vote was 73%.
But what of our other two categorisations – ‘Growing and Changing’ and ‘Established Provincial’. These are more complex, and tended to swing less uniformly one way or the other in the referendum.
In particular, a huge number of authorities fall into the ‘Established Provincial’ grouping: very rural places, non-London suburbs, new towns, university cities, ex-industrial and seaside areas with little history of migration and little recent change, etc.
The pulled-out chart next to the scatter shows the referendum vote among the 218 councils which are below the national average for both size of and change in the non-WB population. These were clearly weighted towards Leave (and it’s worth pointing out that Scotland, with its particular cultural circumstances – and also some Welsh-speaking parts of Wales – disguises the extent of this, accounting for many of the Remain areas in this category).
With that said, the Brexit results are fairly marginal in many of these places, with the mean average across the ‘Established Provincial’ grouping being 45% Remain to 55% Leave. Many, although not all, could be seen as quietly conservative – even ‘one nation’ – rather than hostile to migration or vulnerable to tensions.
Indeed, the ‘Established Provincial’ category is, on the whole, the group among whom ethnocultural factors have the lowest impact. Dover and Mid Sussex, for example, have very similar ethnocultural pictures (with both low level and low change). But the Leave vote was 20% higher in the former than in the latter.
Lastly, let’s look at ‘Growing and Changing’ areas. These places also have more complex relationships with migration and cohesion. Little has been done so far to map the precise attitudes of this type of area, and it’s hard to draw conclusions just using the Brexit outcomes – which were in most cases quite marginal. We might guess that their concerns about demographic change are more economical than cultural, with communities accustomed to large non-WB populations, but nevertheless likely to worry about the effect of increasing numbers on jobs and services.
*
To really understand ‘Growing and Changing’ places, however, it’s important to dig into a second aspect the data, which is the diversity within the non-WB population. Indeed, there is a significant, qualitative difference between areas where the non-WB population is predominantly made up of a single ethnocultural group, and areas where it is more mixed.
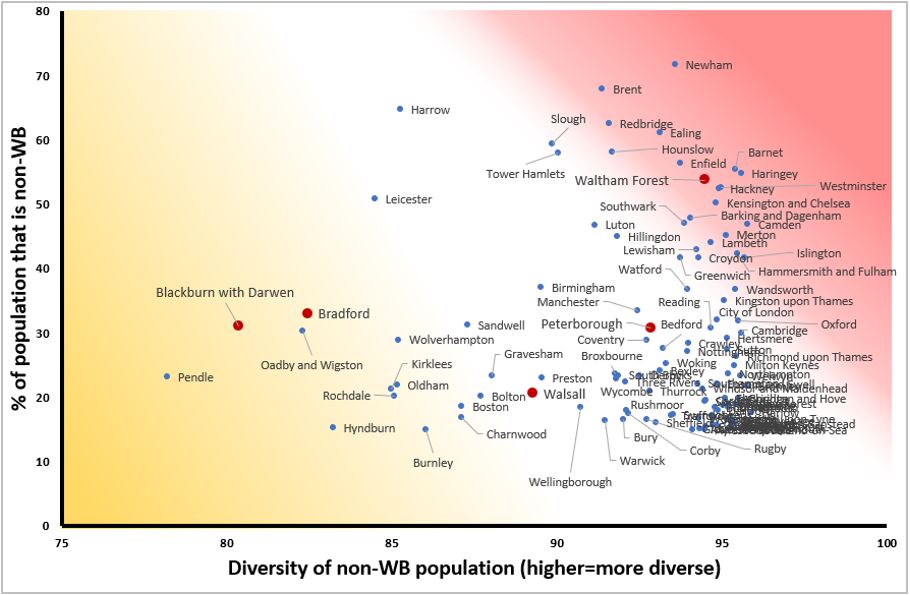
The scatter diagram below charts local authorities onto a new diagram. The size of the non-WB population is this time on the ‘Y’ axis, with Newham and Brent towards the top. And the diversity of the non-WB population features on the ‘X’ axis. Higher scores represent local authorities with a mix of different groups within the non-WB population; lower ones represent those where the non-WB community comes from a single group. The scores are generated by working out the probability, in a given postcode, that two random non-WB residents will belong to two different non-WB Origins categories. Places with single dominant minorities, like Pendle, have lower scores and are further to the left. (Note that on this chart we’ve only included areas with more than 15% of the population is non-WB. Otherwise it gets very cluttered, as places with small non-WB populations are almost all high diversity).

How do we make sense of this?
As most work in the social cohesion field has indicated – right through from the 2001 Cantle Report to the Casey Review – issues often occur in places where people live ‘Parallel Lives’. What we mean by this is that they’re characterised by lower integration and interaction, but what does this really mean?
The cause of ‘Parallel Lives’ is invariably less diversity within the non-WB population, with a single minority group dominant. The alternative to this is ‘Melting Pot’ areas, where the non-WB minority is much more mixed. The spectrum below shows what the differences mean (the colours relate to the above scatter chart, and are again faded by different levels of acuteness).

Challenges in ‘Parallel Lives’ areas are very different to challenges in ‘Melting Pots’. As the name suggests, the former usually have worse cohesion. A homogeneous minority often generates resentment from the WB population, and the sense of a ‘takeover’. And as well as far right extremism and other forms of breakdown in community relations, there are sometimes safeguarding issues too when minority communities become overly self-contained and insular, and have little interaction with the council. (By way of example, note the presence of Rochdale some way to the left of the scatter).
‘Melting Pots’, however, have issues of their own for decision-makers. If there is a very broad mix of different ethnocultural groups then it is harder to establish channels of communication with the leaders of any particular community – and harder to adapt to the service needs of non-WB residents. There is usually more integration, because minorities are often smaller and more open to new cultures and traditions, through living alongside other minorities and having more interaction with the WB population. But there is also more capacity for groups to be overlooked by the council or to become disengaged with the wider community.
As we can see, ‘Parallel Lives’ communities are more common in certain regions. In particular, many parts of Lancashire exhibit these sorts of characteristics. Indeed, almost all the most extreme ‘Parallel Lives’ areas are in and around this part of the UK. It’s no coincidence that the 2001 Mill Town Riots – which began much of the cohesion debate 17 years ago – took place in these areas.
Blackburn and Bradford’s integration plans will need to work hard to reflect this – perhaps via more bespoke relationship-building. By contrast, a council like Waltham Forest will arguably have different challenges, to do with creating a coherent sense of place, and addressing service pressures.
*
The table below shows the overall top line figures for the five authorities.
However, in truth the reality in each postcode will be much more granular – with pockets of certain non-WB groups, waves of change, and certain communities living in proximity to change without experiencing it. Narratives and strategies which reflect this are vital.

Cohesion is immensely complex, after all, and the more you drill down geographically, the more you begin to see particular issues around change and diversity within specific areas. Meanwhile, cultural histories and relationships with migration remain powerful in binding areas together, and proximity to other areas remains a key factor. No two places are the same.
But by using modern innovations like Origins, authorities are increasingly able to develop the foundations of a more preventative approach to ethnocultural tensions, based on how people respond to change and build senses of place. In so doing, councils in a post-Brexit context can start to get to the root causes of issues, and create more united and resilient communities.

